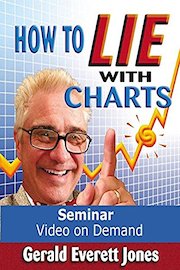
How to Lie with Charts - Training Video on Demand from 2010 is a fascinating and informative movie that revolves around the art of presenting statistical data through charts and graphs. The movie stars Gerald Everett Jones, an expert in data analysis and a renowned author of several books on the subject. The movie is a comprehensive guide that teaches viewers how to manipulate and misrepresent data through the use of charts and graphs. While this may sound unethical, the movie is not promoting such practices but rather educating viewers on how to avoid falling prey to these tactics.
Through the course of the movie, Mr. Jones explains various techniques that are used to misrepresent data. These include selecting inappropriate scales, using misleading units of measurement, cherry-picking data, and hiding information by using complicated charts that are difficult to interpret. He also explains how certain types of charts, such as line charts or pie charts, can be manipulated to show different aspects of the data.
The movie is divided into several segments, each of which covers a specific topic related to chart manipulation. One such segment explains how to use data visualization tools to create professional-looking charts that are both visually appealing and misleading. Mr. Jones also warns against using too much color, 3D effects, and other design elements that can distract from the actual data being presented.
Another segment covers the importance of choosing the right type of chart for the data being presented. Mr. Jones explains that different types of charts are suitable for different types of data and that choosing the wrong type of chart can make the data difficult to interpret. He provides examples of how some charts, such as stacked bar charts or stacked area charts, can make the data appear more significant or less significant than it actually is.
The movie also covers how to use statistics to manipulate data. Mr. Jones explains how choosing the right statistical measure, such as mean or median, can significantly affect the perception of the data. He also explains how to use statistical significance to make data appear more or less significant than it actually is.
Throughout the movie, Mr. Jones emphasizes the importance of being skeptical of data that is presented in charts and graphs. He encourages viewers to question the source of the data, the methods used to collect the data, and the presentation of the data itself. He also recommends using common sense to interpret the data and to look for trends or patterns that may not be immediately apparent.
The movie is presented in a clear and concise manner, making it easy for viewers to understand the concepts being presented. It uses real-world examples to illustrate how different techniques can be used to manipulate data, making it an engaging and informative watch.
In conclusion, How to Lie with Charts - Training Video on Demand from 2010 is an excellent movie for anyone who wants to improve their understanding of data analysis and visualization. It provides valuable insights into the manipulative practices that are sometimes used to misrepresent data, while also emphasizing the importance of being a critical consumer of data. The movie is highly recommended for professionals and students alike who want to gain a better understanding of how to present and interpret data effectively.